Verification
To verify the functionality of our design, we have created a verification environment. We used Vivado’s support for Systemverilog. Although UVM verification was a much better choice to start with, however, when we started the project, there was no support for UVM in Vivado. Currently, Vivado 2020 supports UVM based verification but our verification is still based on a simple class-based verification. In the following sections, we provide an overview of what has been implemented. Also, we will review how new tests can be added and how to run simulations.
Verification Environement
Fig. 16 illustrates the overall architecture of our verification environment. For simplicity, we will review the verification environment in PITO. However, both MVU and BARVINN follow the same verification structure. There are four main verification components in our verification design:
Testbench Monitor
Testbench Predictor
Testbench Base
Testbench Top
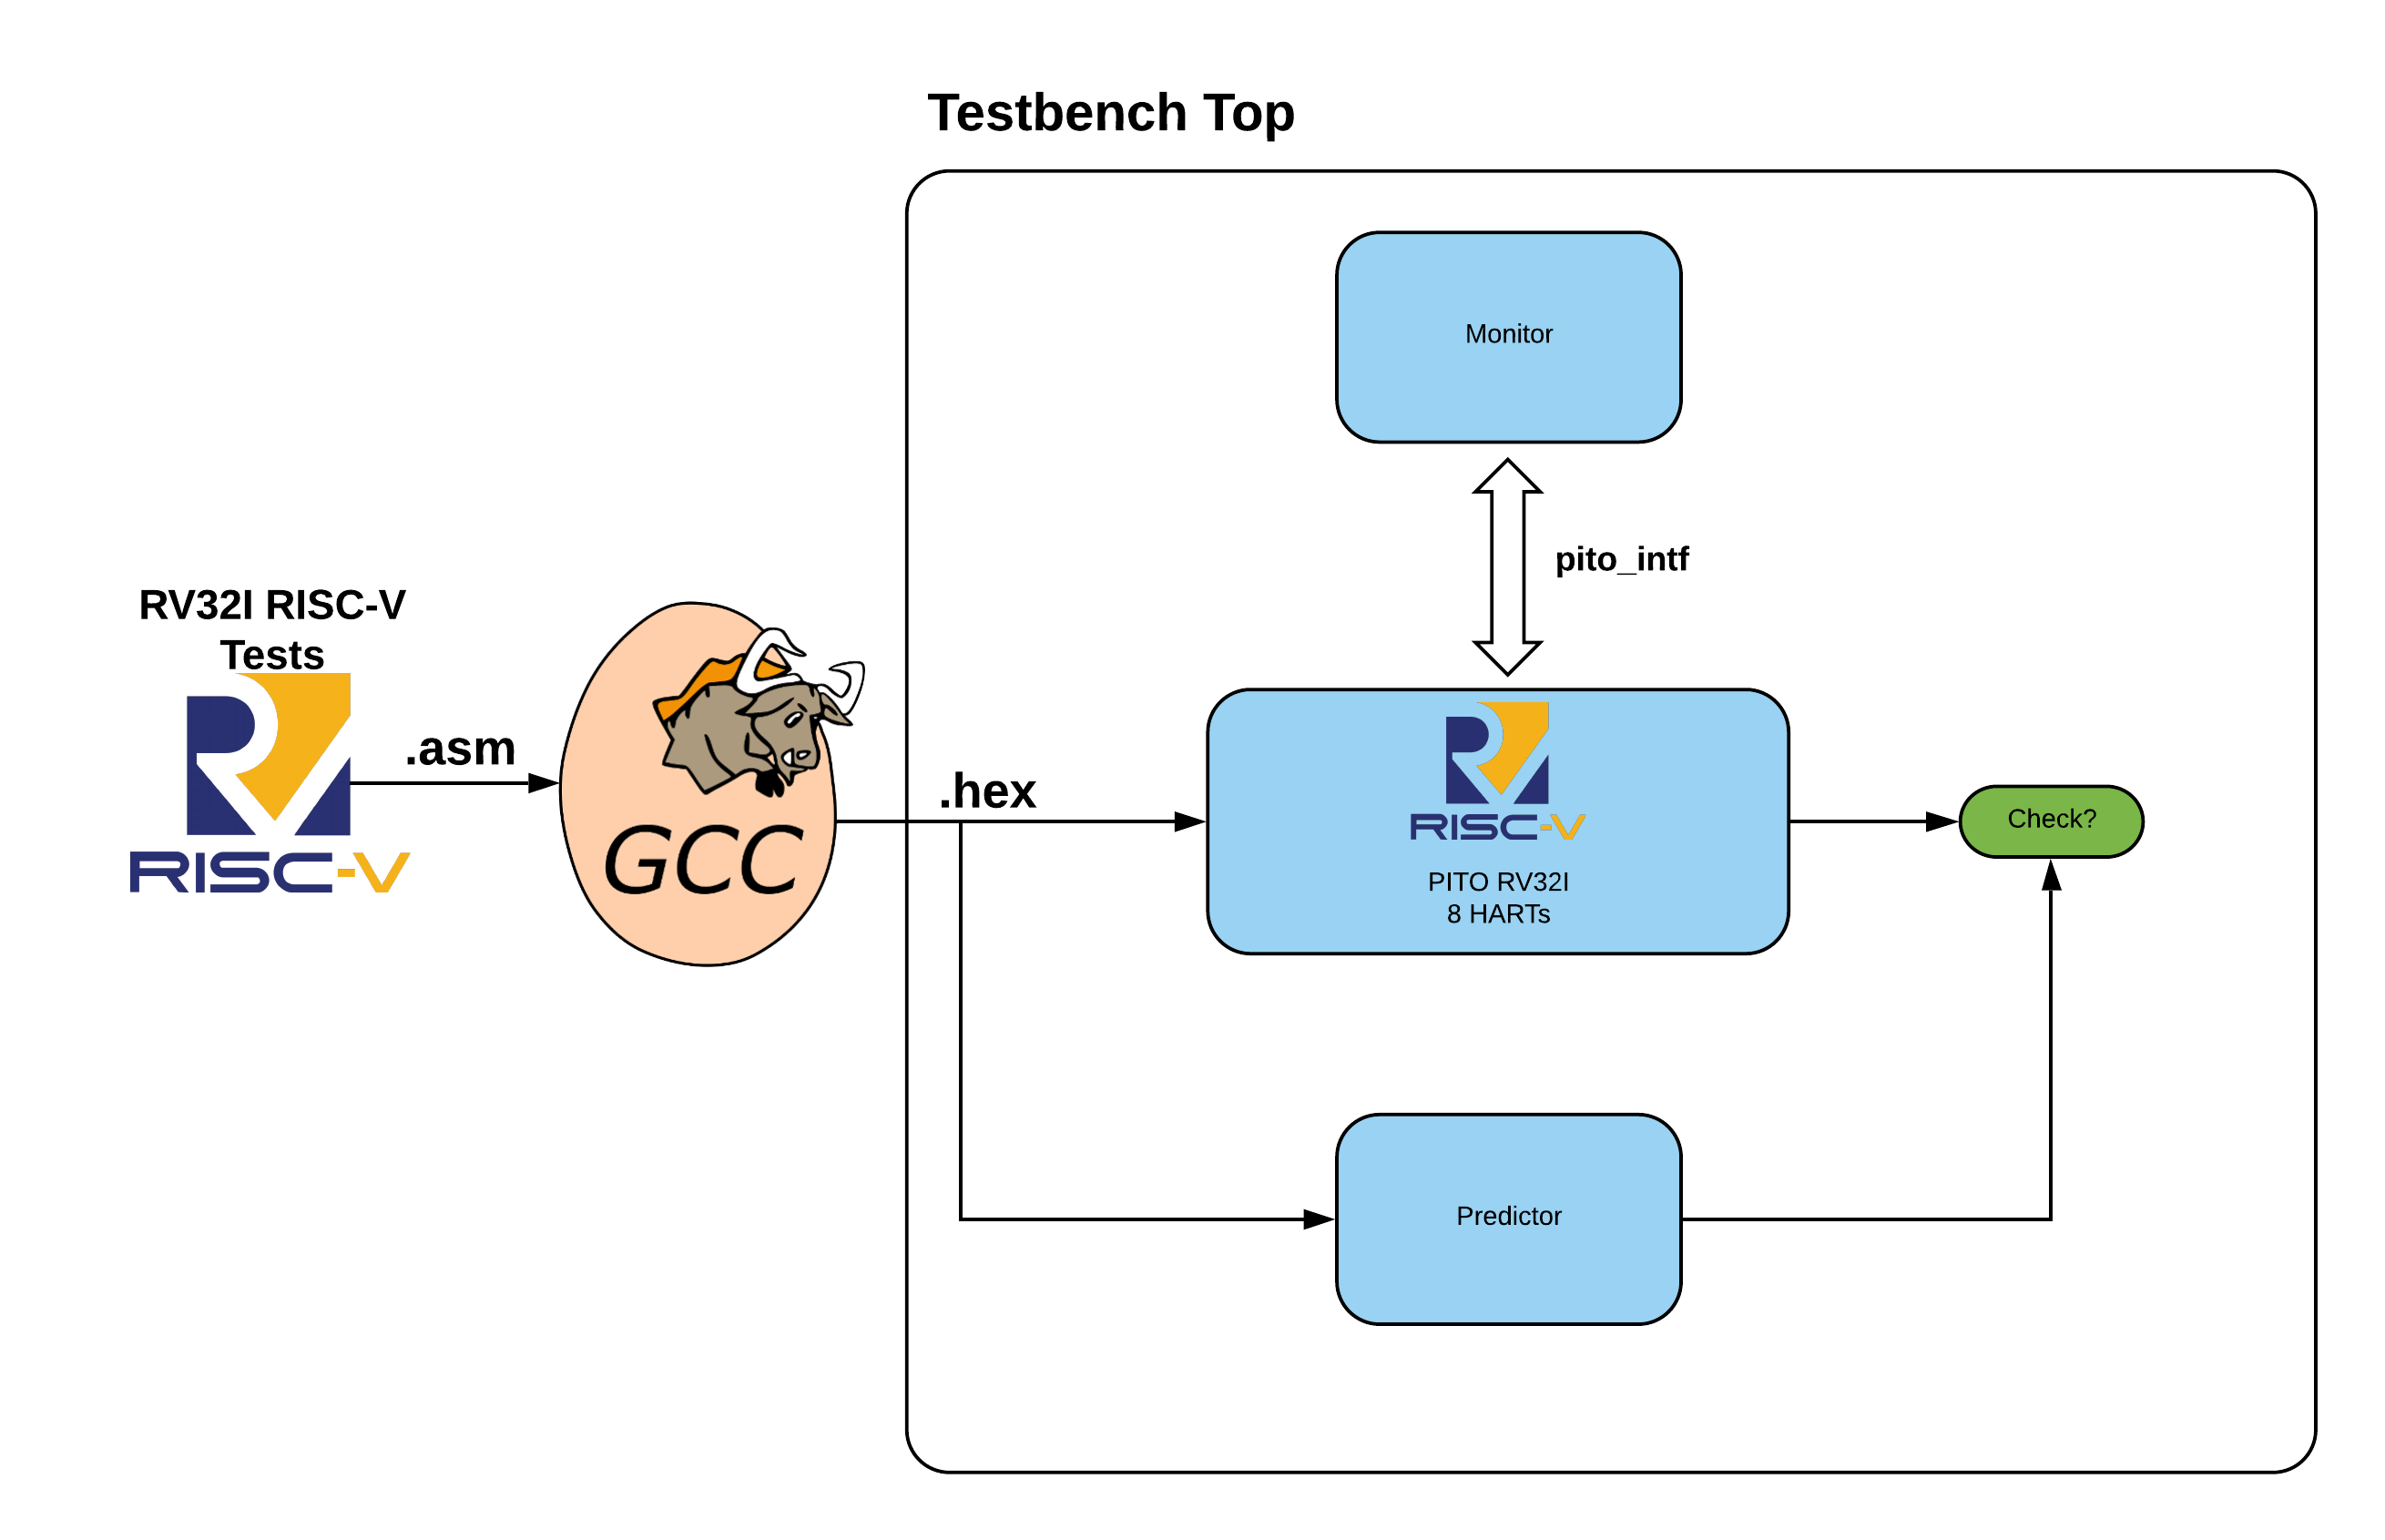
Fig. 16 Verification Environment for PITO, showcasing how RISC-V tests are verified in our design.
Testbench Monitor
In our design, a Testbench Monitor is a testbench module that monitors transactions inside the DUT. In PITO the Testbench Monitor module is named pito_monitor. An important task of pito_monitor is to sync with the DUT. This is a crucial step since our predictor module and DUT must be in the exact same state to allow the predictor module to correctly predict the next state. pito_monitor syncs to DUT by checking if the first instruction in the firmware is correctly executed by the DUT. Once the monitor found such an instruction, it will move to the sync state. Otherwise, it will wait for a predetermined wait period NUM_WAIT_CYCELS until it times out and halts the simulation.
Once the sync period is done, pito_monitor samples data for the predictor module. In PITO verification environment, pito_monitor class instantiates a RV32IPredictor module and uses hdl path and pito_interface to monitor transactions within the DUT. On every clock cycle, pito_monitor samples the DUT’s CSR, register file and memory as well as the executed instruction. It then passes all these samples to the RV32IPredictor module.
Testbench Predictor
A testbench predictor module is responsible to predict the state of each hardware block in the DUT. There are many industry proven predictors. As an example, Spike is a RISC-V simulator that provides functional model for different RISC-V ISA. It can also be integrated with Systemverilog through SyetemVerilog DPI. However, we decided to write our own functional model of PITO since Spike does not support a Barrel design. As an example, in PITO, there is no logic to prevent data or control hazards. On the other hand, although Spike supports multiple harts, a normal data path with data and control hazard has been implemented. Hence, Spike in its default format is unable to correctly predict the DUT behavior.
RV32IPredictor module is a functional model of PITO written in SystemVerilog. It supports all base RV32I instructions. For every instruction that is executed in the DUT, our predictor can predict the expected results. RV32IPredictor is designed to support as many harts as is required. It also contains the base RISC-V CSRs plus the custom CSRs that we added for configuring the MVU.
The RV32IPredictor module has no direct connection to the DUT. All the transactions are sampled by the monitor module and then they are provided to the predictor module. Hence, as mentioned before, it is crucial for the monitor module to sync correctly with the DUT. Once the predictor module receives a sample from the monitor, it will process the instruction and it will update the test_stat variable to be used by the testbench.
Testbench Base
Testbench base is a SystemVerilog class that contains testbench predictor and testbench monitor class. Figure Fig. 17 illustrates the class structure for our verification environment. As it can be seen, the testbench base class (pito_testbench_base in PITO verification environment) should be used as the base class for all other test classes. Each test has three phases, testbench setup phase, testbench run phase and testbench report phase. All these phases are virtual tasks that allow the user to override them.
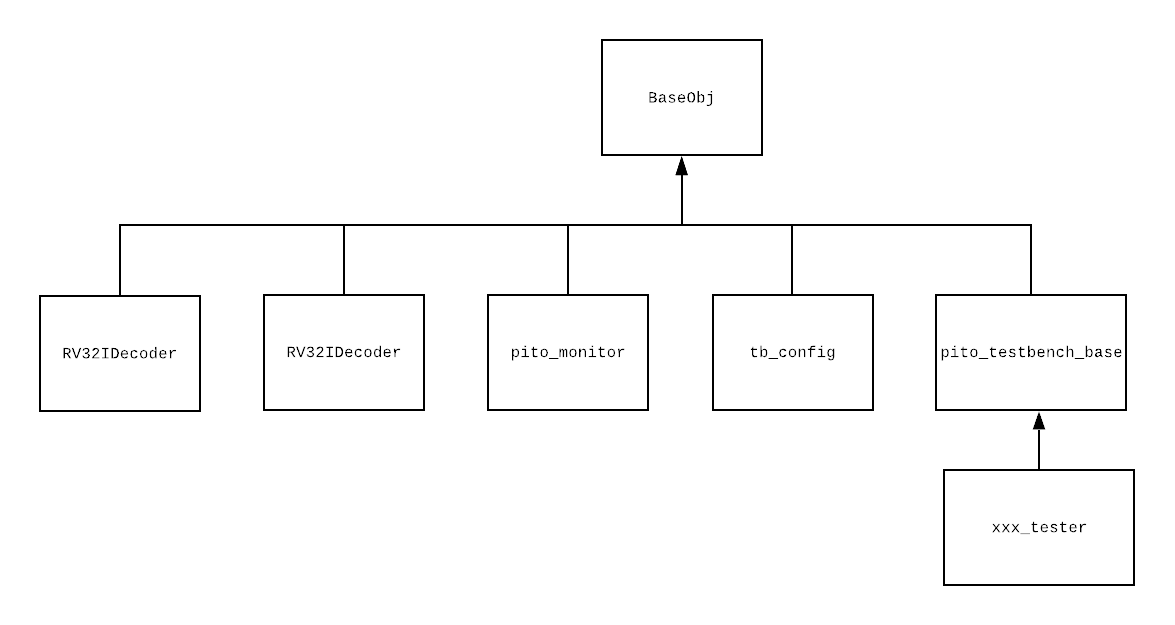
Fig. 17 Class structure of PITO verification
In the testbench setup phase, we usually put the DUT into reset mode and we will provide reset configurations. At this stage, we should load any firmware into the instruction ram and load data ram with the data generated by the compiler. We should also initialize the register files and prepare the start sequence for the processor. However, this can be overwritten by the test in case there are other things that need to be added. In the testbench run phase, we usually run the firmware on the DUT. However, before that, we should kick start the monitor to sync with the DUT. Finally, in the report phase, we report the result of the test. The testbench base class has a test_stat variable that is passed to the monitor class. In the report phase, we will use this data structure to report the result of the test.
Testbench Top
Unlike the previous testbench components, the testbench top is a SystemVerilog module. As it can be seen in Fig. 16, the testbench top module instantiate all the other components (DUT, tests, interface). It also connects the DUT to the testbench through the interface. Another important task of this module is to call the three phase of the testbench that was described earlier. The testbench top module also provides the clock signal for the entire system.
Running a Test in PITO Verification Environment
Our design supports FuseSoC. In order to run any of the tests provided, you will first need to make make sure that the Vivado is available in the system. We currently support Vivado 2019.1:
source /opt/Xilinx/Vivado/2019.1/settings64.sh
Then, make sure you have fusesoc installed:
python3 -m pip install fusesoc
Then add pito to your fusesoc libraries:
git clone https://github.com/hossein1387/pito_riscv.git
cd pito_riscv
fusesoc library add pito .
Then run simulation (No GUI):
fusesoc run --target=sim pito
For synthesis:
fusesoc run --target=synth pito
To open sim in GUI mode:
cd build/pito_0/sim-vivado/
make run-gui
And for synthesis:
cd build/pito_0/synth-vivado/
make build-gui
This should open the project for you. Make sure you have run simulation or synthesis at least once, otherwise FuseSoC would not create a project file for you.